People who get curious about FIRE (Financial Independence, Retire Early) find two kinds of tool. Backtesters are powerful and dense, and give the answer as one success rate. Planners are polished but want an account, some setup, and a subscription for the useful parts. Neither shows the arithmetic, and both tend to present a 4% withdrawal rate as a fact. The research does not agree on 4%.
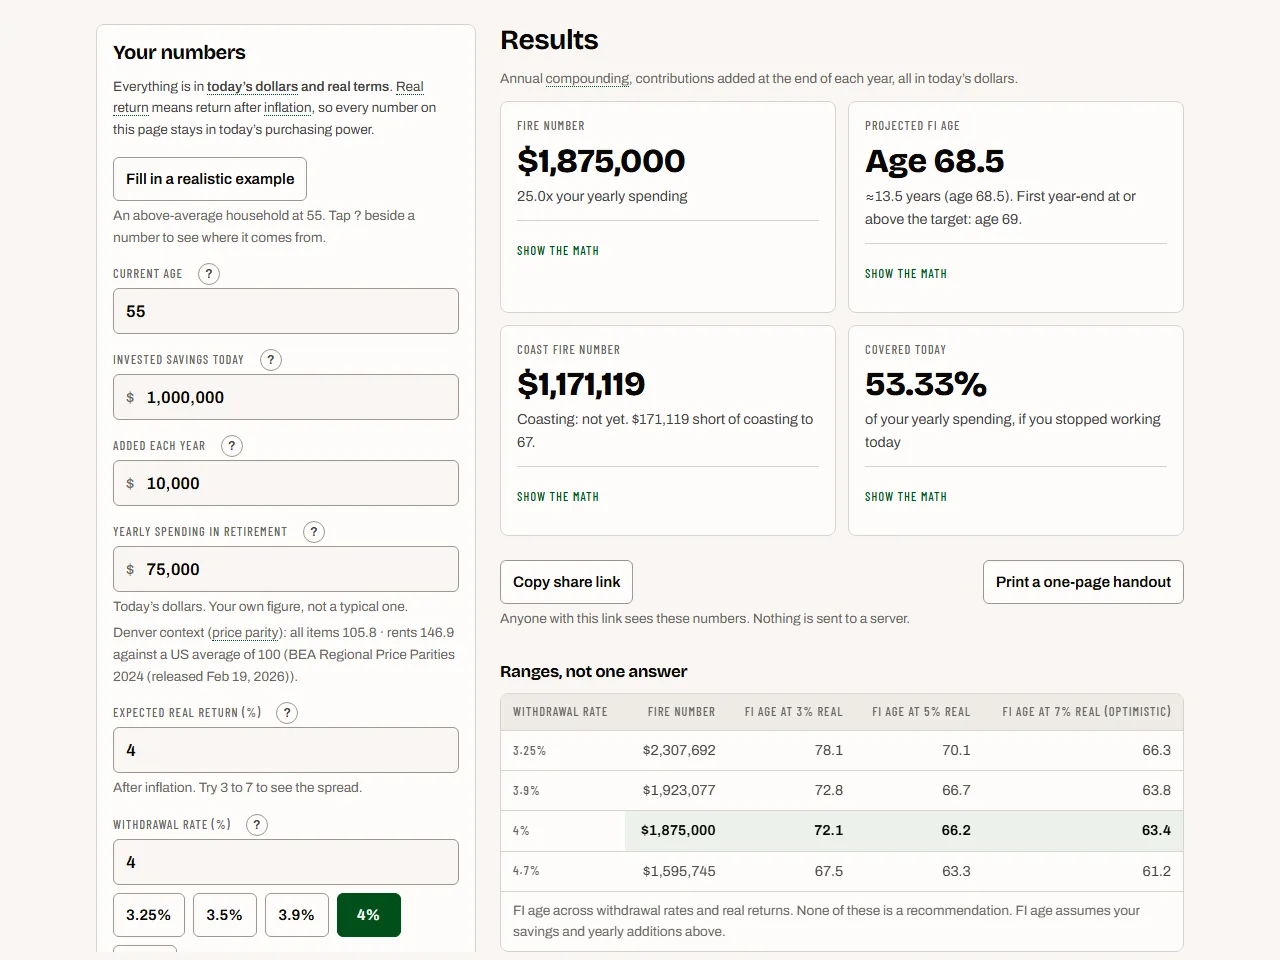
This one takes six numbers and returns four: the FIRE number, the age you would reach it, the Coast FIRE number, and how much of your spending your savings cover today. Every result has a “Show the math” link that writes out the formula with your numbers in it. There is no account and no sign-up, and nothing you type leaves the browser.
Ranges, Not One Answer
Under the four results sits a table of withdrawal rates from 3.25% to 4.7% against real returns of 3%, 5% and 7%. Each cell is a FIRE number or an FI age. The table exists because the studies behind those rates disagree, and a single cell presented alone would hide that.
The rest of the page adds savings at each age as a table and a chart, an income-offset view, Barista, Lean and Fat FIRE variants, a habits checklist, contribution limits, and the Colorado rules that change the picture for someone retiring there. A “Fill in a realistic example” button loads one household, and a ”?” beside each of its numbers says where that number comes from.
A savings-rate lens draws how the years to FI fall as the share of income saved rises, with its data table and math beside it. The FI age shows both the exact age and the first whole year-end, and when other income such as Social Security starts after FI, a bridge line says how much the savings have to cover until then.
Share It With a Neighbor
A share link carries the plan in the address itself, after a #, so it never reaches a server. It is written only when the button is pressed. Opening someone else’s link pauses saving rather than overwriting your own saved plan, and editing a number drops the link from the address bar. A one-page print handout lays out the results, the range table and the math for the fridge or a conversation.
Cash Flow, One Month at a Time
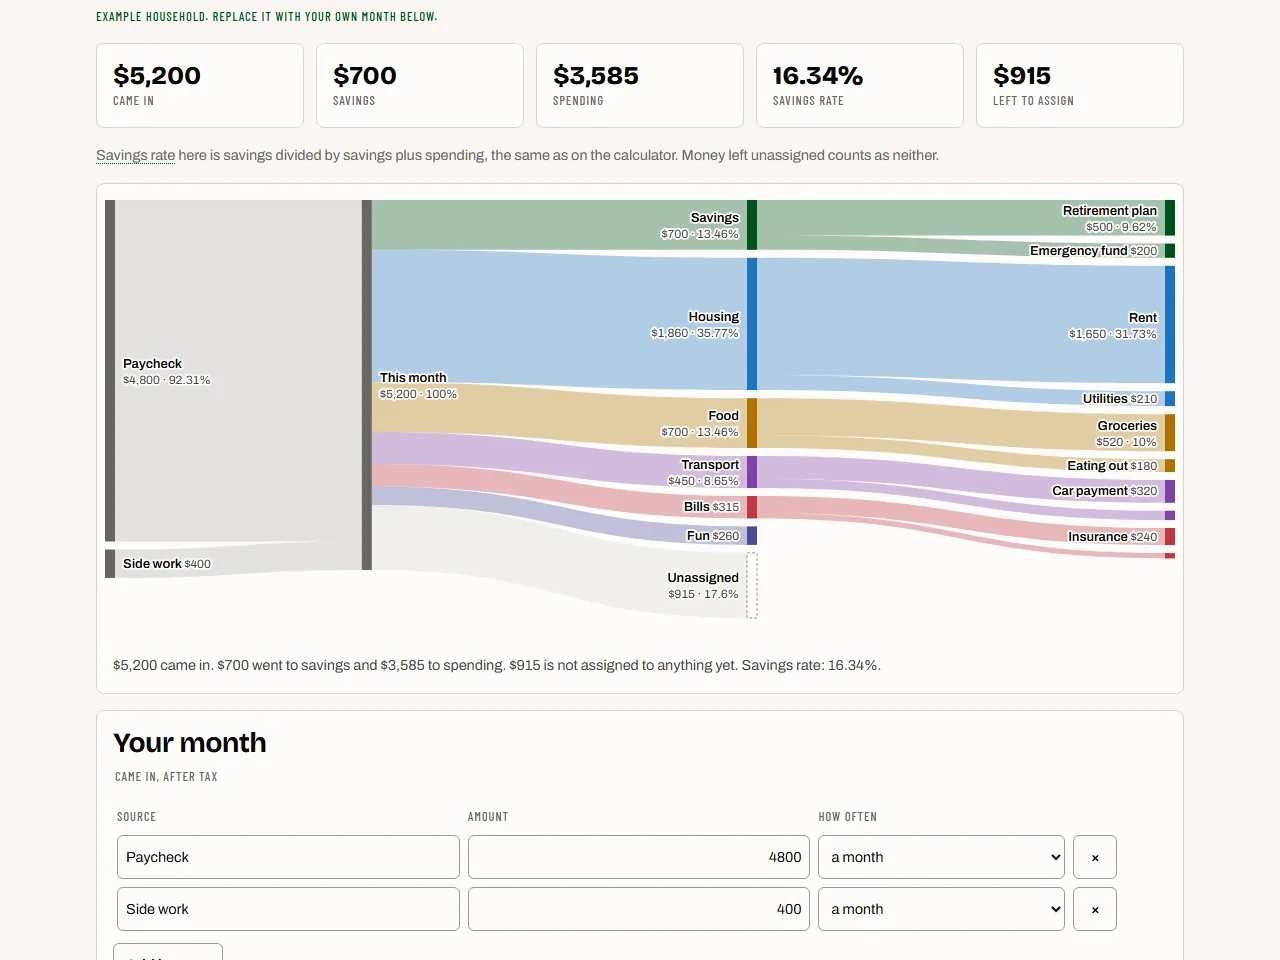
Friends who tried the calculator asked “now what?” and pointed at the paycheck-to-categories charts in budgeting apps. The Cash flow page is this site’s version, typed by hand with no bank connection. You enter one month of take-home income and where it went, as lines under groups, and the page draws bands from each income source through the month’s total to each group and on to its lines, one dollar the same height in every column. Money not assigned gets a dashed “Unassigned” bar and spending past income gets a “Shortfall” source, so the map never hides a gap.
Each spending group has its own colour, shared by its bar, its bands, and its dot in the editor and the table. The six chart colours were added to the Wanessa Labs tokens for data only and checked for colour-blind separation. Pointing at a band lights its whole path from income to line; clicking pins it, and “Edit this” puts the cursor in the field behind it. The editor is one card per group with a monthly subtotal, and each line has a “How often”, so a paycheck every two weeks or a yearly bill turns into a month correctly. A tile shows “Left to assign”, or “Over by” once spending passes income. “Use these in the calculator” carries the month’s savings and spending across as a year.
The map holds one month and a spreadsheet can hold all of them. “Download as a spreadsheet” saves the month as a CSV with the month on every row, so the next month can be pasted under it, and “Load a spreadsheet” reads the file back and shows the latest month. The file is made and read in the browser, and nothing leaves the device.
Checking In Under the Map
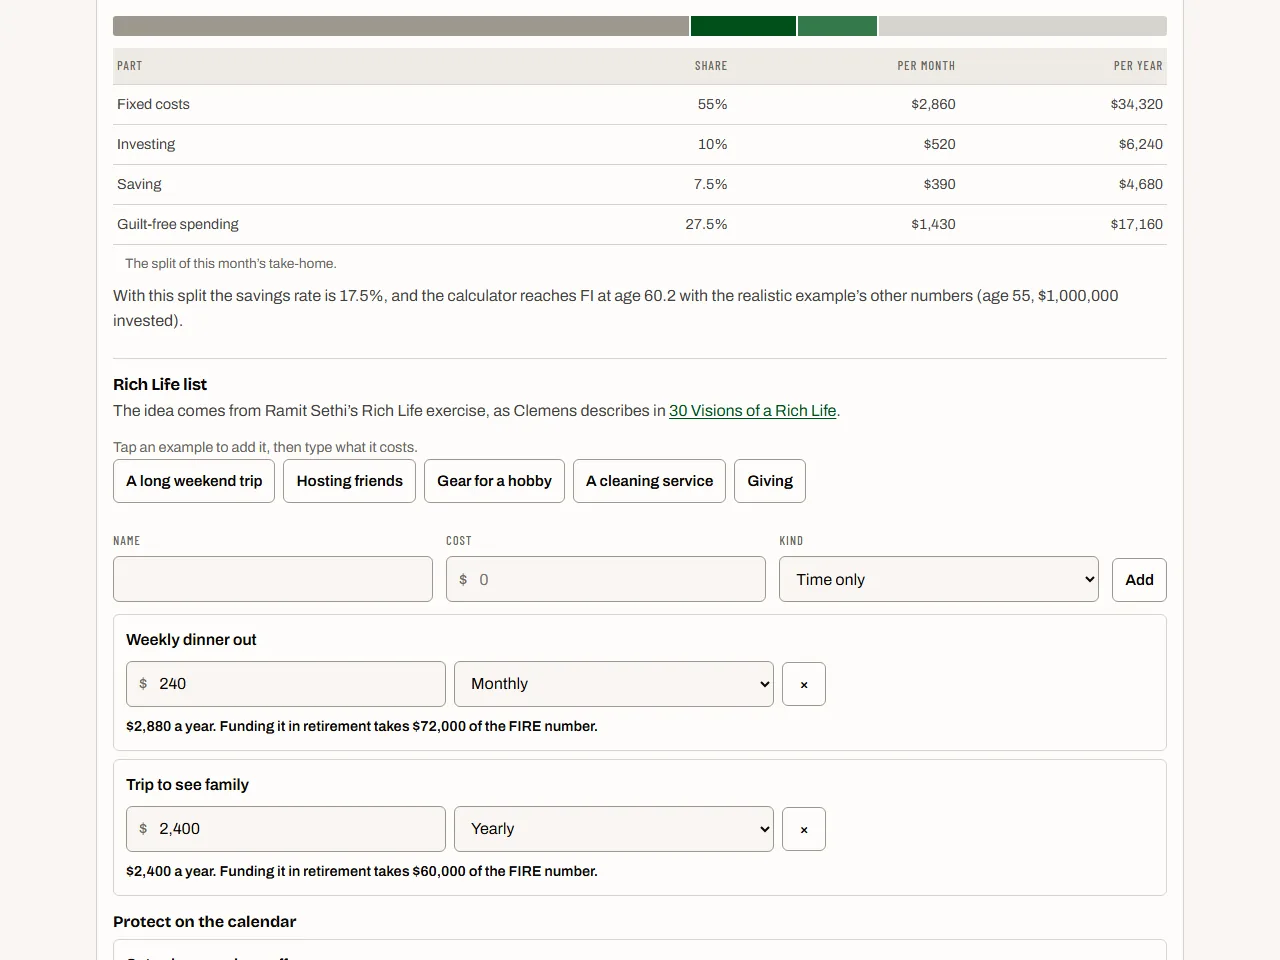
Below the map sit three sections built on the same month. This month’s check sets the month’s net beside the savings rate the calculator’s numbers imply, and lists four habits some people track. Rules people set covers five, from a cooling-off wait before a larger purchase to Nick Maggiulli’s “don’t sweat it” threshold of 0.01% of net worth, credited to his own page. Invested savings stands in for net worth there. Budget frameworks splits the month four ways: 50/30/20 (shown as a common rule of thumb), Ramit Sethi’s Conscious Spending Plan (credited to his page), pay yourself first, and a savings-rate-first split that works back from an FI age.
The Conscious Spending Plan carries a Rich Life list. You add the things the guilt-free share is for, monthly, yearly, one-time or time only, and each recurring one shows what funding it in retirement adds to the FIRE number. The list is there because a recurring cost moves the FIRE number far more than a one-off one. Each rule and framework has “Apply to calculator”, which opens the calculator with the numbers it implies. These sections were planned as a separate page and folded into Cash flow, so the month is typed once.
Money Upkeep
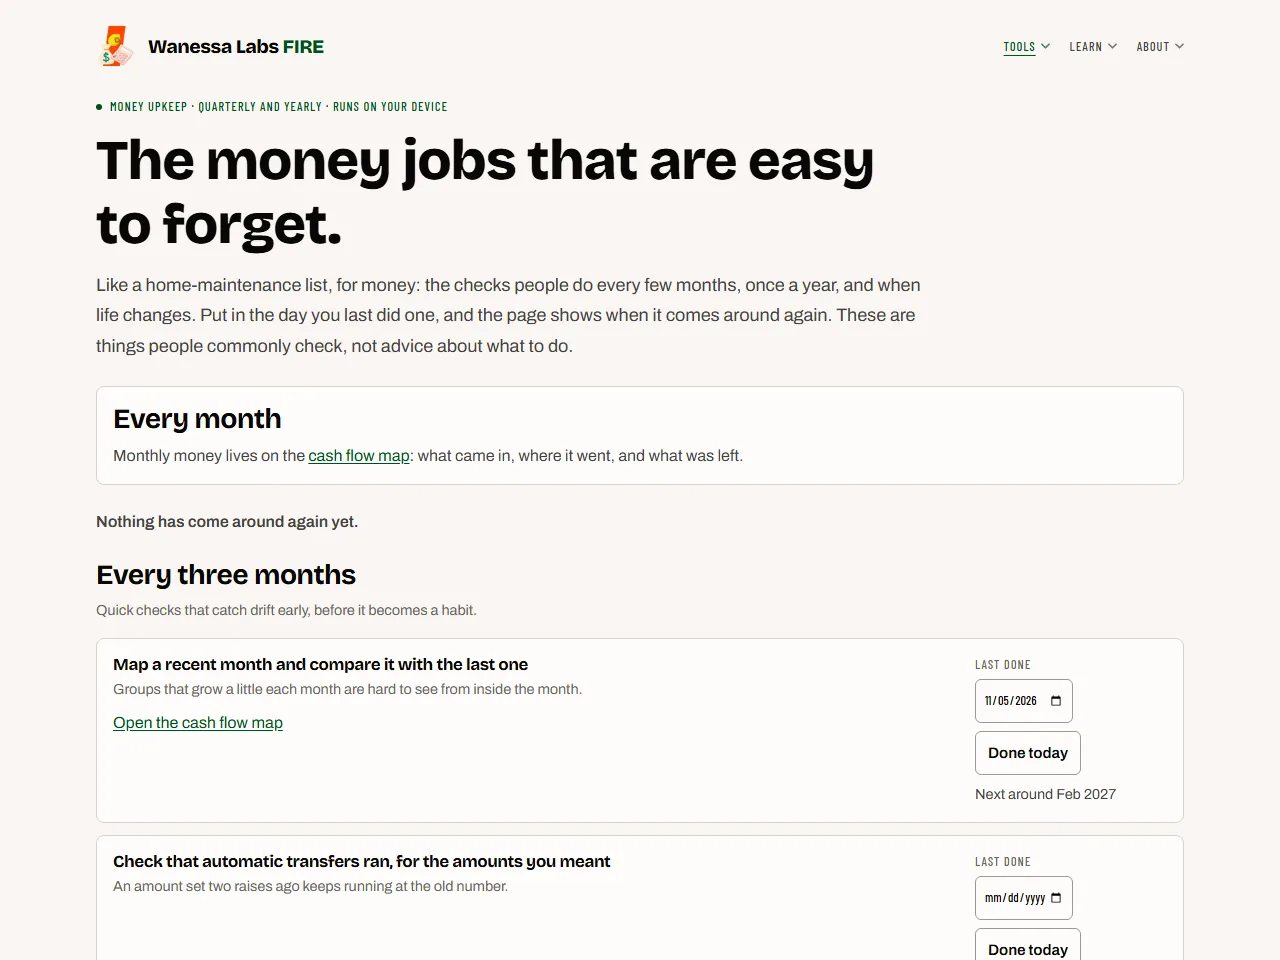
The slower money jobs get their own page, set out like a home-maintenance list: five every three months, eight once a year, and three for when life changes. Each says what people check and why, with a link where the site or the IRS has the next step. A “Last done” date and a “Done today” button show when each job comes around again, and the dates stay on the device, stored only if you tick “Remember these dates”. Monthly money points back to the cash-flow map.
The site grew to six pages, so the nav became three dropdowns in the wanessalabs.com style: Tools (Calculator, Cash flow, Money upkeep), Learn (Reels, Play all, Game, Everything’s connected) and About (Method and sources, Glossary, Disclaimer, and links out to Wanessa Labs and Clemens).
The calculator stopped being the front door once there was more to see. The address now opens on a short home page that leads with Cash flow, then a card for each tool and each Learn item, written from the same list the nav reads, so every tool is described once. The calculator moved to its own page, and every link already out in the world (share links, reel links, “Apply” links) still lands on it with its numbers.
Every Number Has a Source
Every outside figure lives in one constants file with its source, a link, its data year, and the date it was last checked. A test prints a stale warning once a yearly figure falls behind the calendar. A figure that reached the project second-hand stays marked that way on the About page until a primary source confirms it, and four of them were promoted that way before launch.
The tool is education, not advice. It names product types such as a CD or an index fund, but never a security, ticker, fund, issuer or broker, and the disclaimer appears in three places. The rules and frameworks are described as things people do, and none is presented as the one to follow.
No Network, Enforced
A build check fails the build on any fetch, beacon, socket, inline script, or off-site script or stylesheet. It was tested by injecting each one and watching it fail before the pass was trusted. Fonts are bundled locally.
The first deploy showed why that rule exists. Astro had inlined two small scripts, and the site’s content security policy allows scripts from its own origin only, so the results tabs and the disclaimer’s Dismiss button were dead on Cloudflare and fine in local preview, which never applies the headers file. The fix turned inlining off, and the build check now refuses any inline script.
Learn: 26 Short Reels
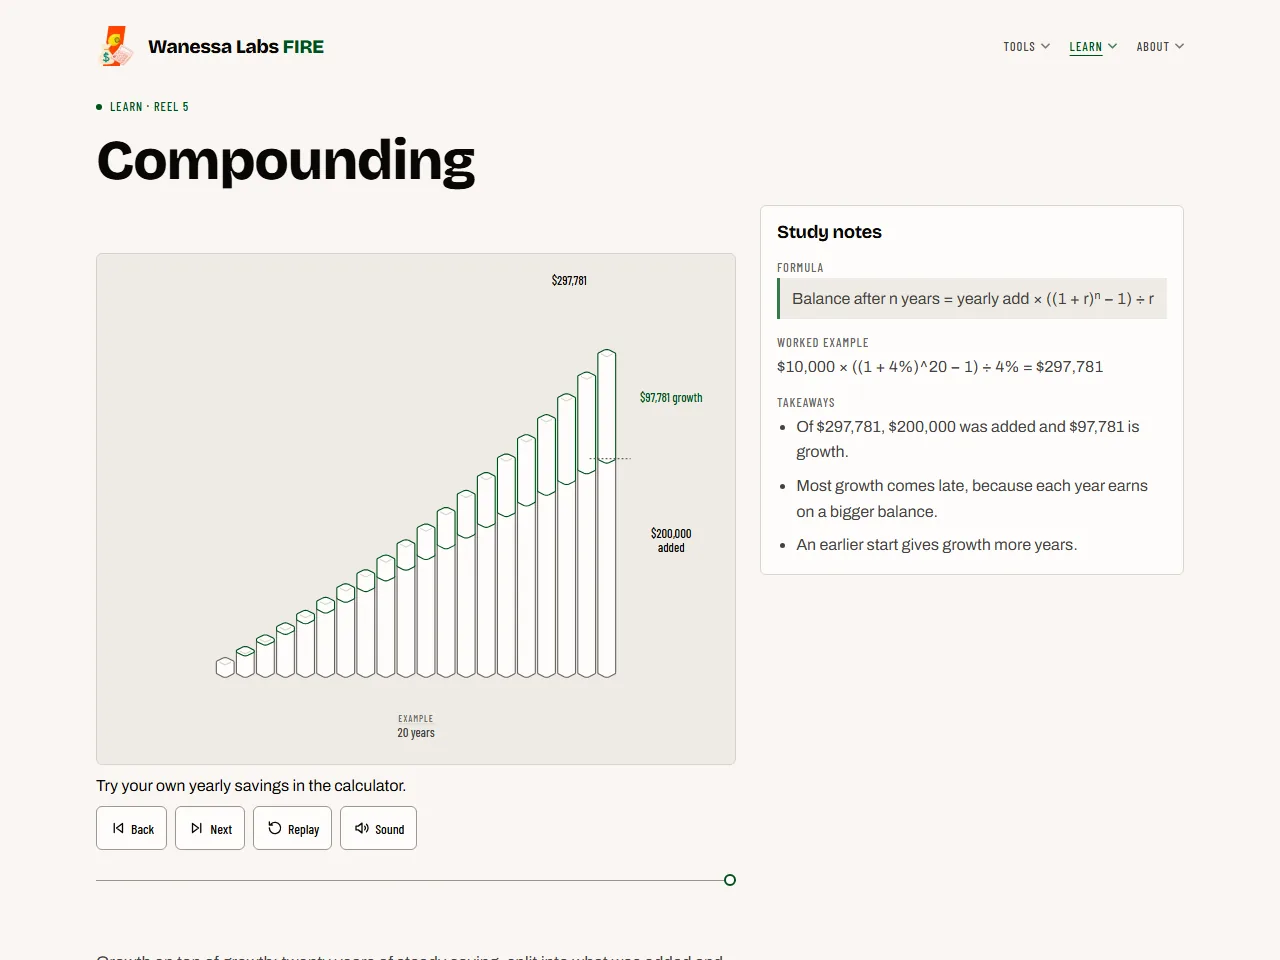
The Learn tab holds 26 reels of about a minute each: 15 on the core ideas, 3 on Colorado rules, and 8 on places money can sit, from a checking account to crypto. Each is a fixed-camera scene drawn with the same Hairline line kernel as the figures on this site, with a British voiceover rendered locally through Voicebox and Kokoro and placed on its beats with ffmpeg.
Every number a caption states is computed from the calculator’s own formulas and sourced constants, and the test kit fails any other number. The voiceover reads the captions verbatim, so the same check covers the audio, and a test fails if a caption no longer matches what was recorded. Play all runs every reel in order with the sound on. Each reel page has study notes: the formula, that reel’s numbers worked through it, and two to four takeaways. With reduced motion turned on, a reel never advances by itself and steps beat by beat instead.
Someone who opens a single reel gets an “Up next” card under it, with the next reel’s title and summary, a Watch next button, and Play all from that reel. When the reel ends, the card takes the accent colour and scrolls into view, so starting anywhere still leads somewhere.
The Jars Game
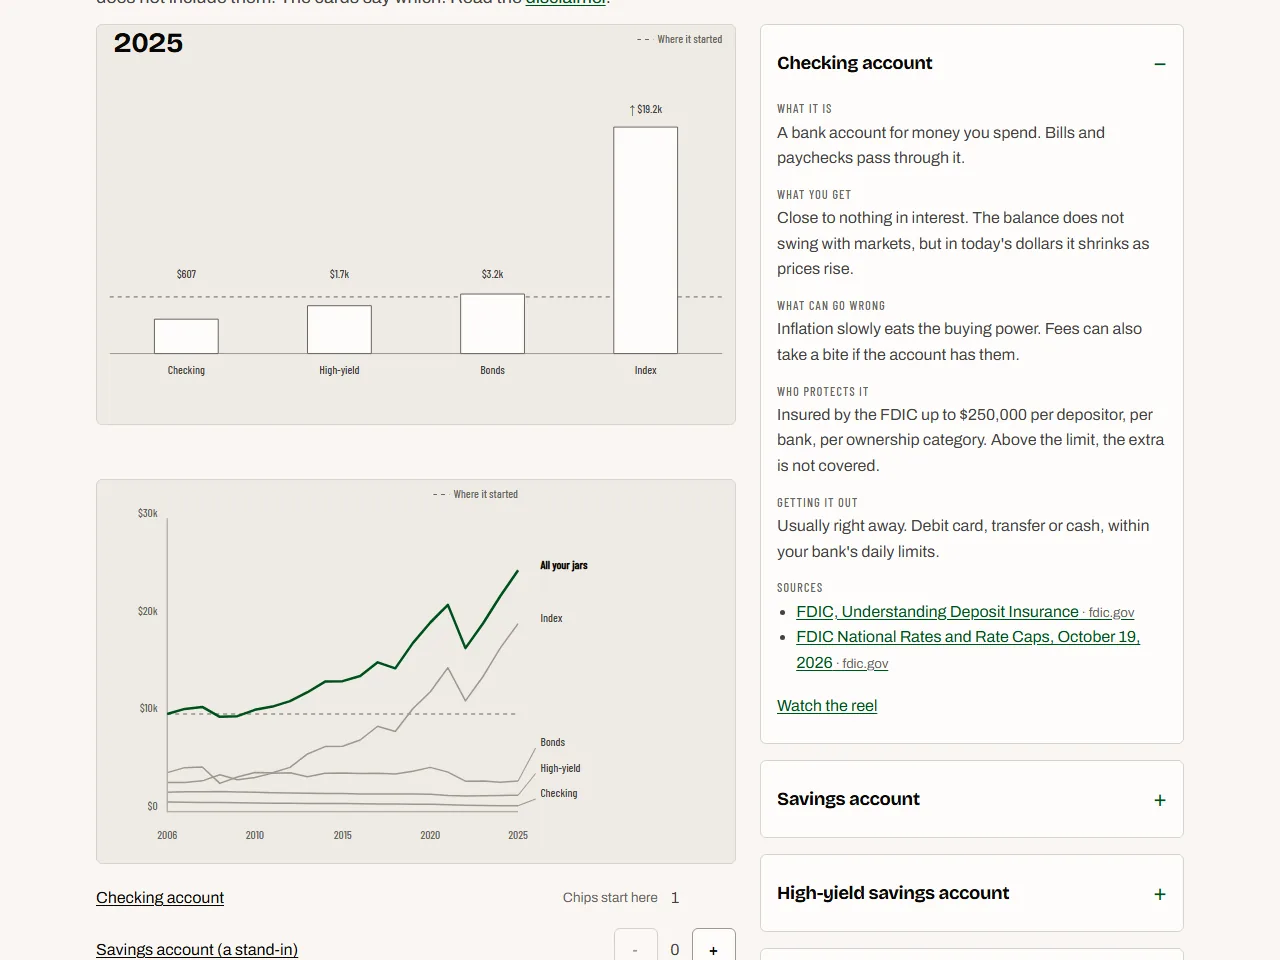
“Where could $10,000 sit?” hands you ten $1,000 chips to spread across eight jars, then plays a real 20-year stretch of US history, using Damodaran’s yearly returns for 1928 to 2025, as bars and a line chart in today’s dollars. A start-year picker plays any 20-year stretch, from the one starting in 1928 to the one ending in 2025, and a Latest 20 years button plays the most recent one in a tap. A random draw is still there. A table shows every start year, a share link reproduces a run, and a diversification chapter plays three fixed mixes through four hard stretches. In 2022 every mix fell, the cash mix included, and the page says so.
Where the history has no series for a jar, it says what stands in. Savings is marked as a stand-in and the single stock as a model, wherever their figures appear. Crypto has a card but is not played: its record is too short. The eight product cards beside the game open one at a time, each with a link to its own reel. The game is in the Learn menu, under Game.
Everything Is Connected
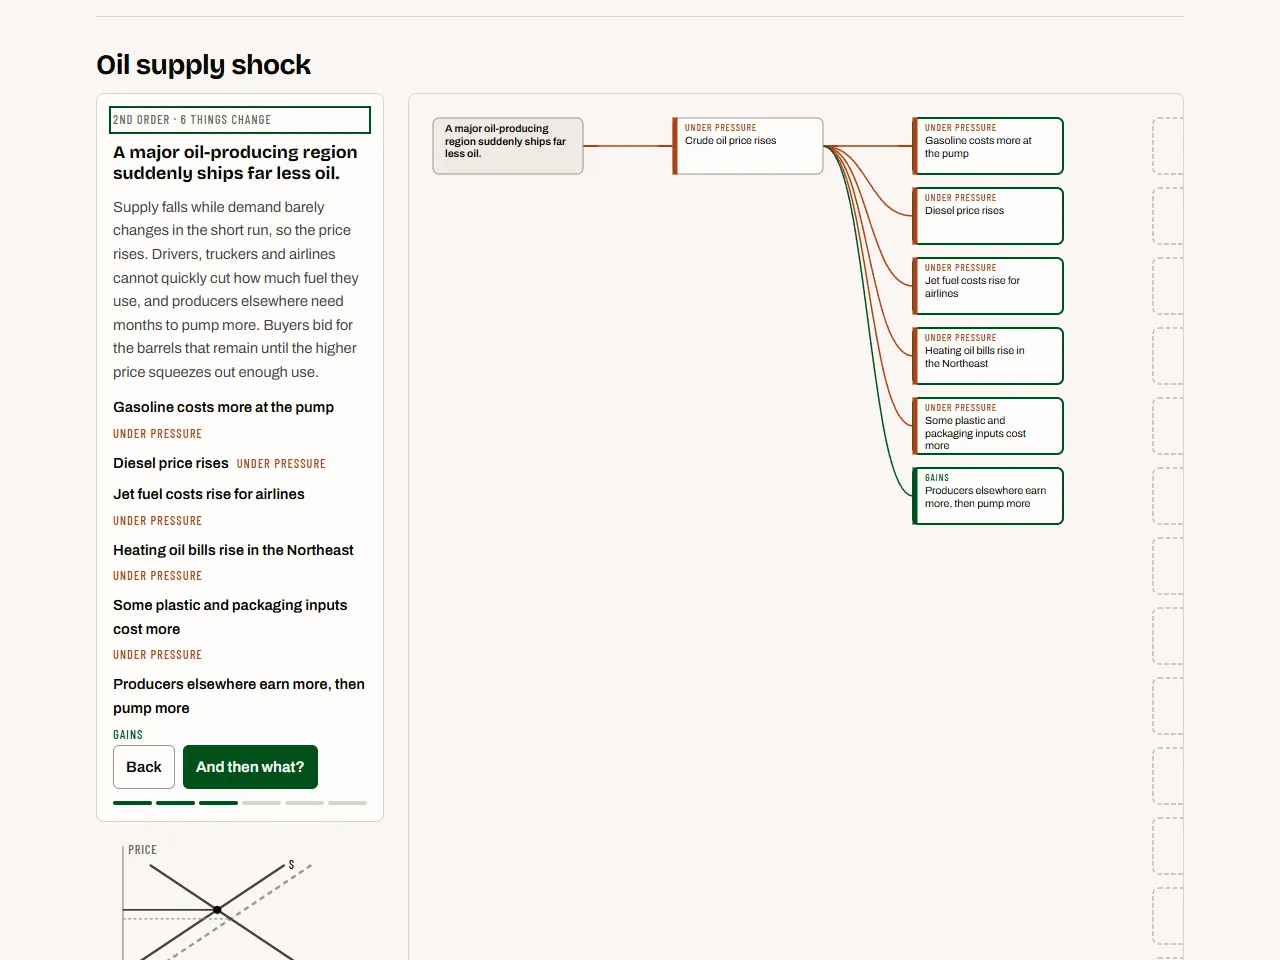
Pick a piece of news, such as an oil shock, a rate hike or a drought in the corn belt, and keep asking “and then what?”. Ten scenarios each open with a small supply-and-demand sketch, then a map that grows one step at a time, four to six steps out, reaching fuel, food, jobs, rent and loan rates. Tap any box for why it moves and where that link comes from. Some effects circle back to where they started, and each loop has a button that lights its steps. 147 links cite a public source, including US agencies, the Fed, the IMF and the World Bank; the rest are labelled common reasoning. The page talks about sectors and groups of people, never a company, ticker or market call.
The Build
Astro 7 static output and vanilla TypeScript, with no framework island, since nothing here needs reactivity beyond recomputing on input. The math is a pure module tested against known answers; Vitest and jsdom cover the rest, 1,133 tests at the last count. The cash-flow map is an SVG string built by a pure function, rendered once at build time so the page reads before any script runs, with no chart library. It is hosted on Cloudflare Pages by direct upload, with a strict content security policy.