
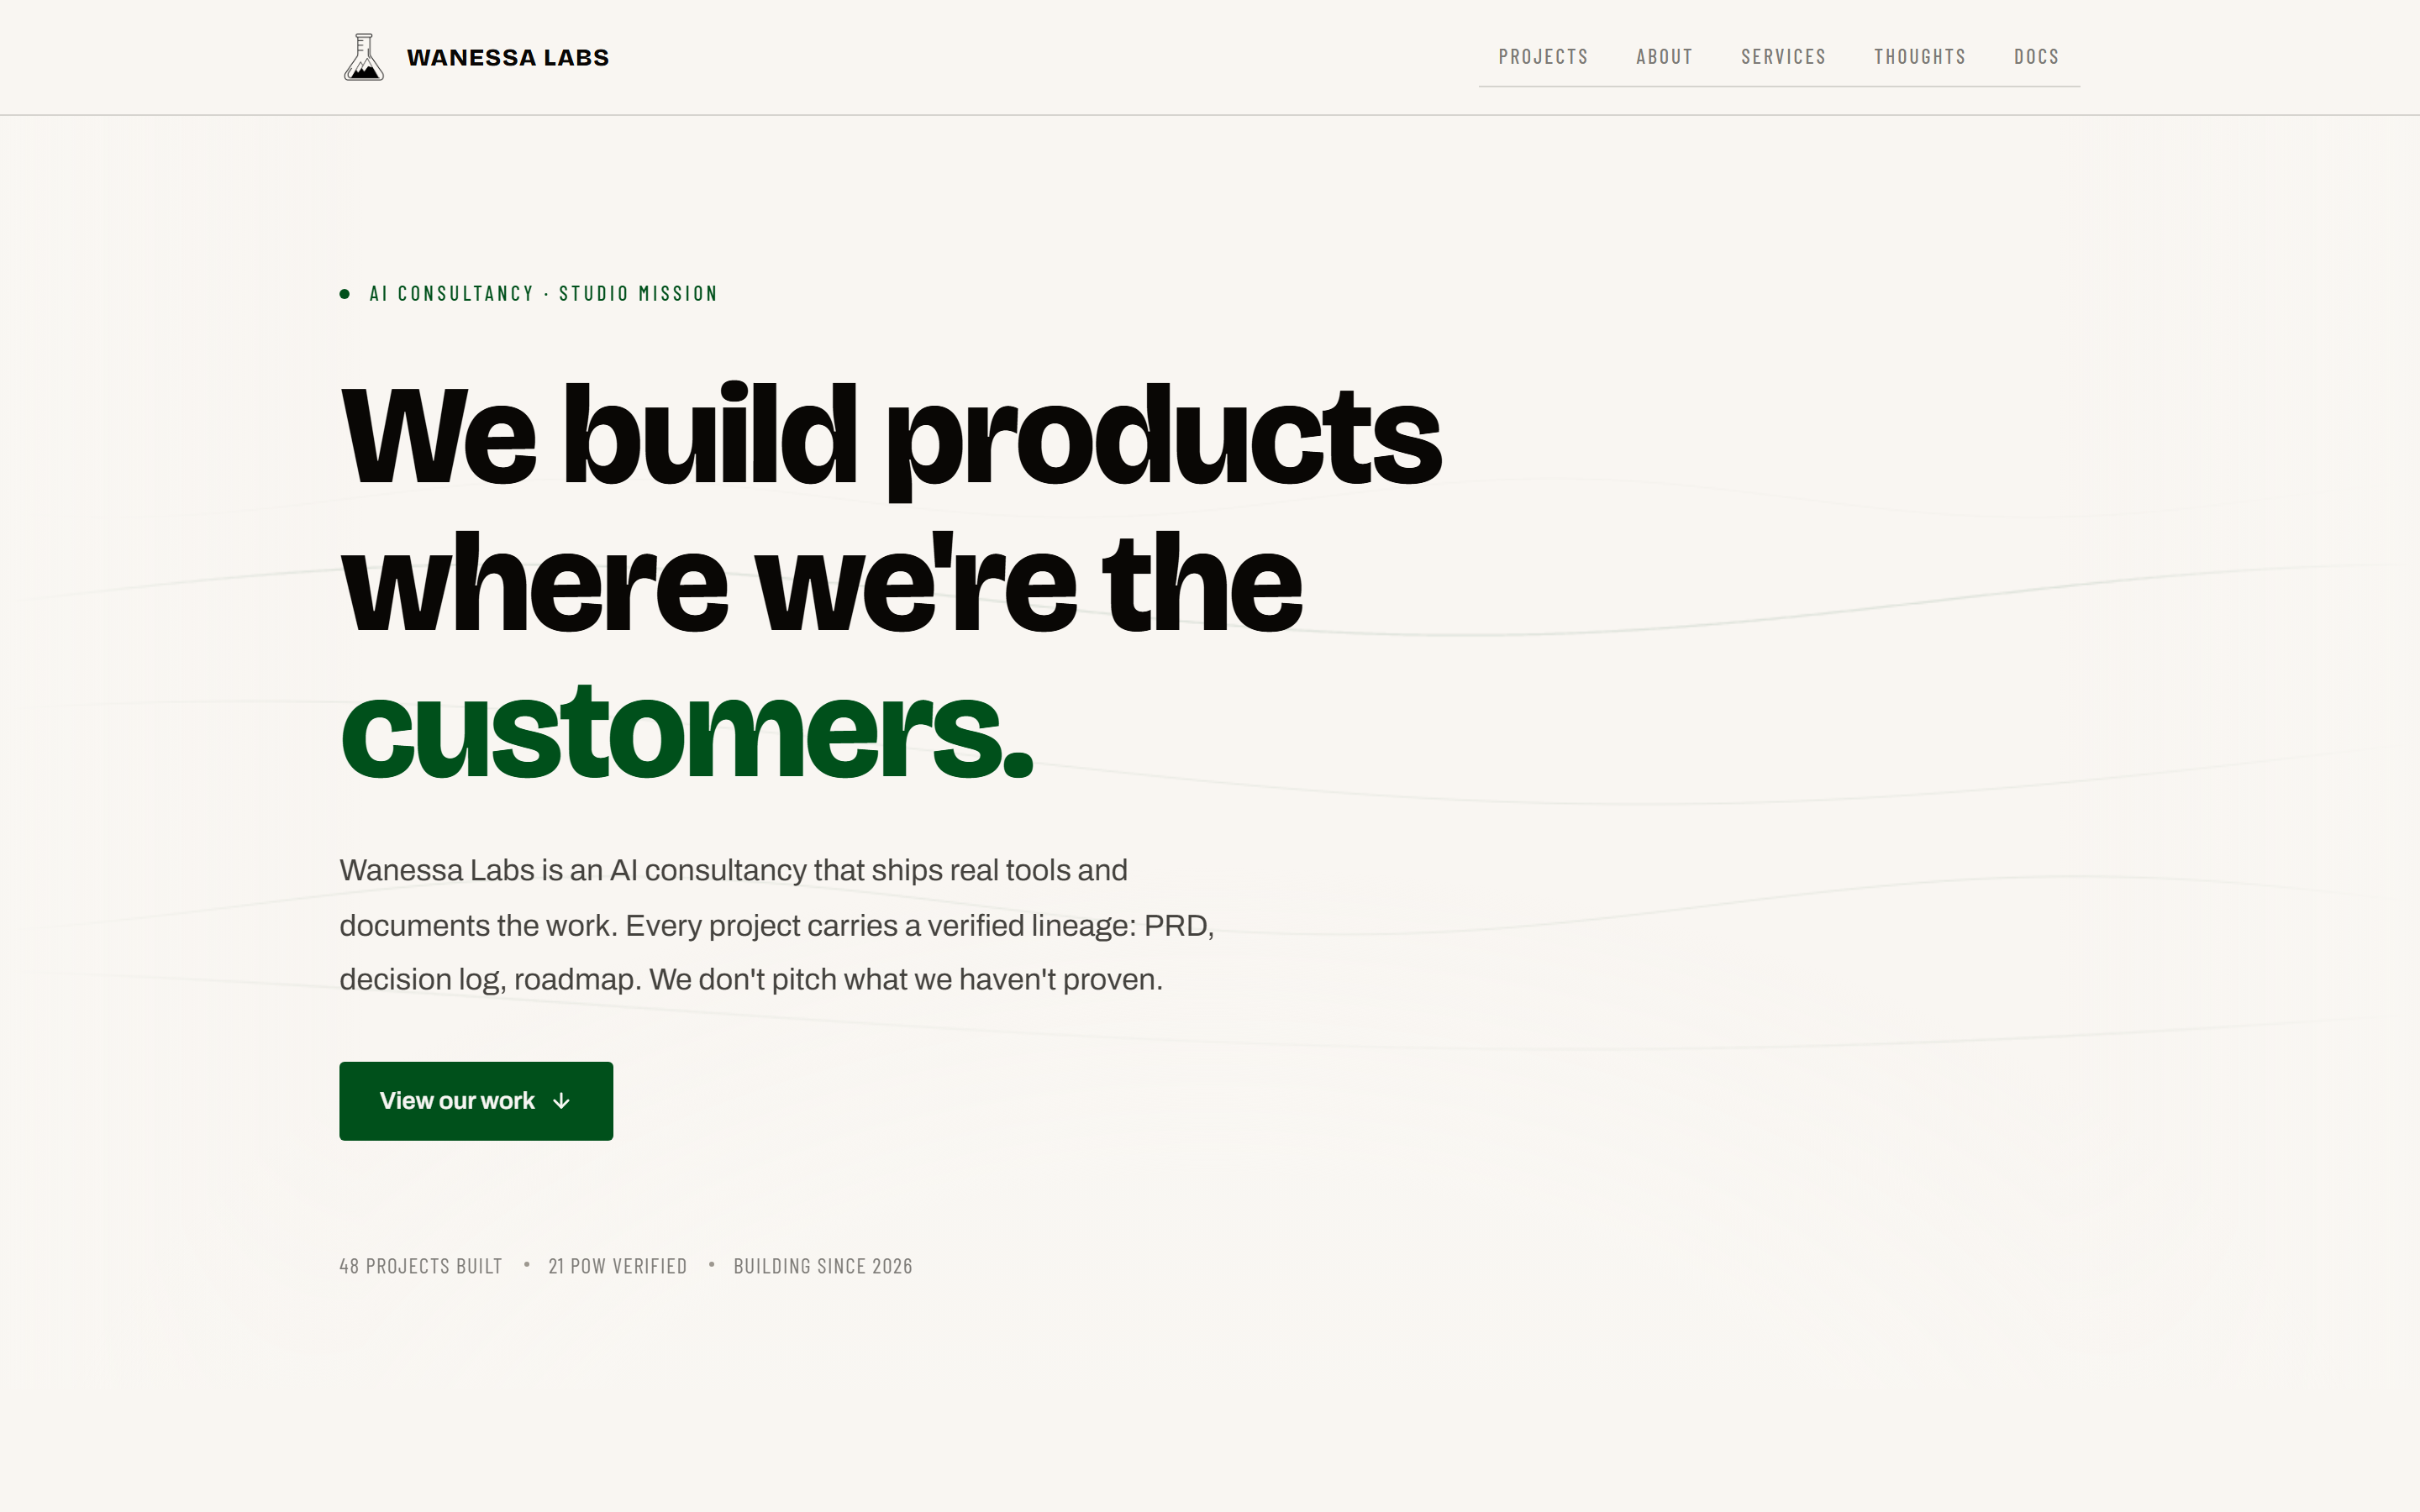
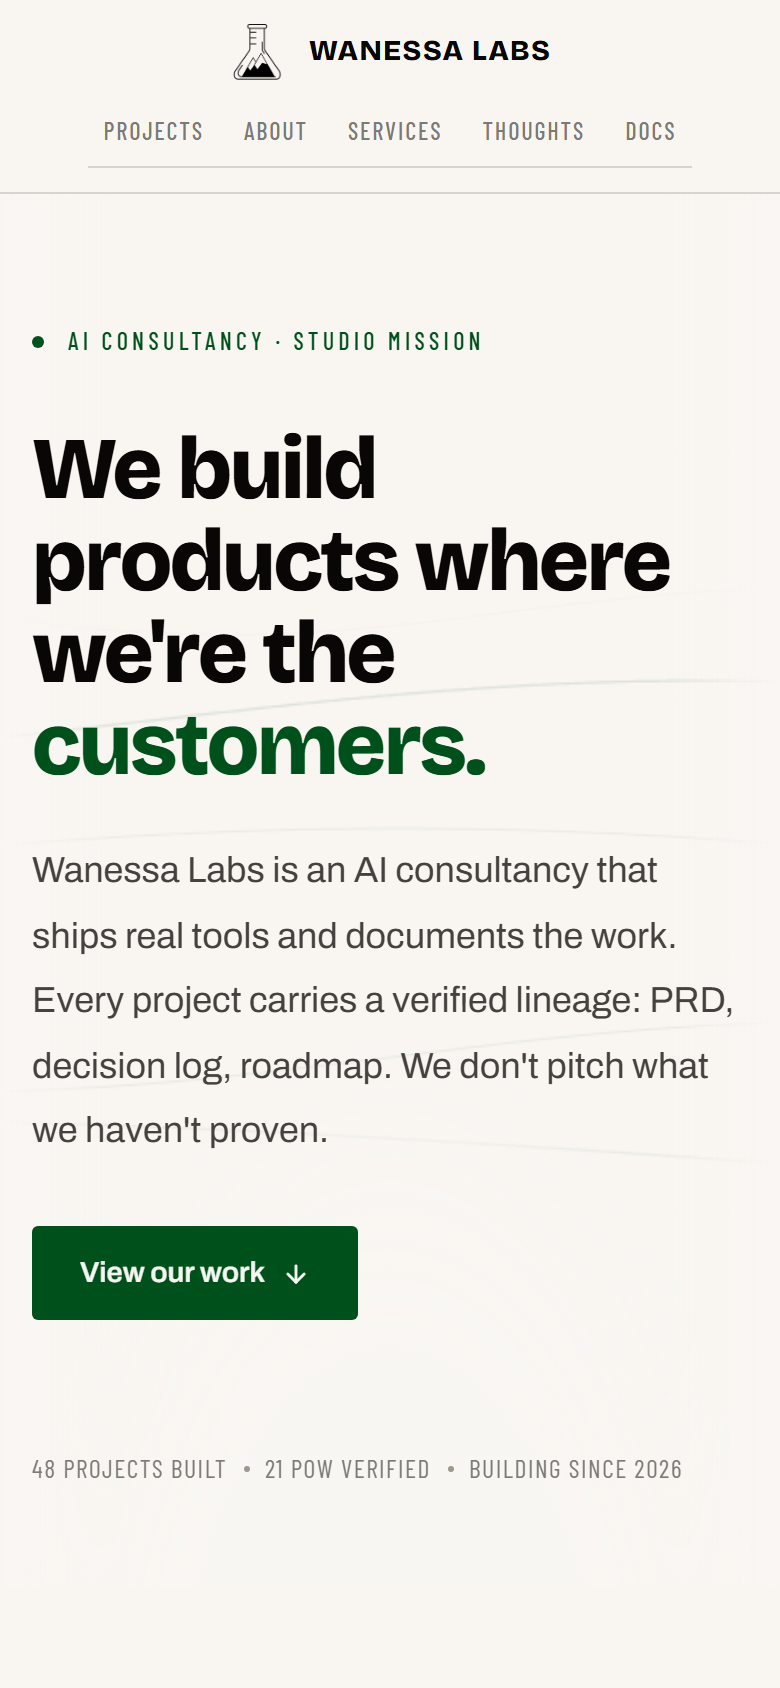
The previous site was slow and generic. LinkedIn is rented land. I needed a credible proof surface where anyone could verify what I’ve actually built in under 30 seconds. So I built this one.
The Problem
Consultants and builders have the same credibility problem: any claim they make about themselves lives on someone else’s platform. LinkedIn, Twitter, Substack: all rented land. You need a surface you own that shows the work, not just describes it.
What It Is
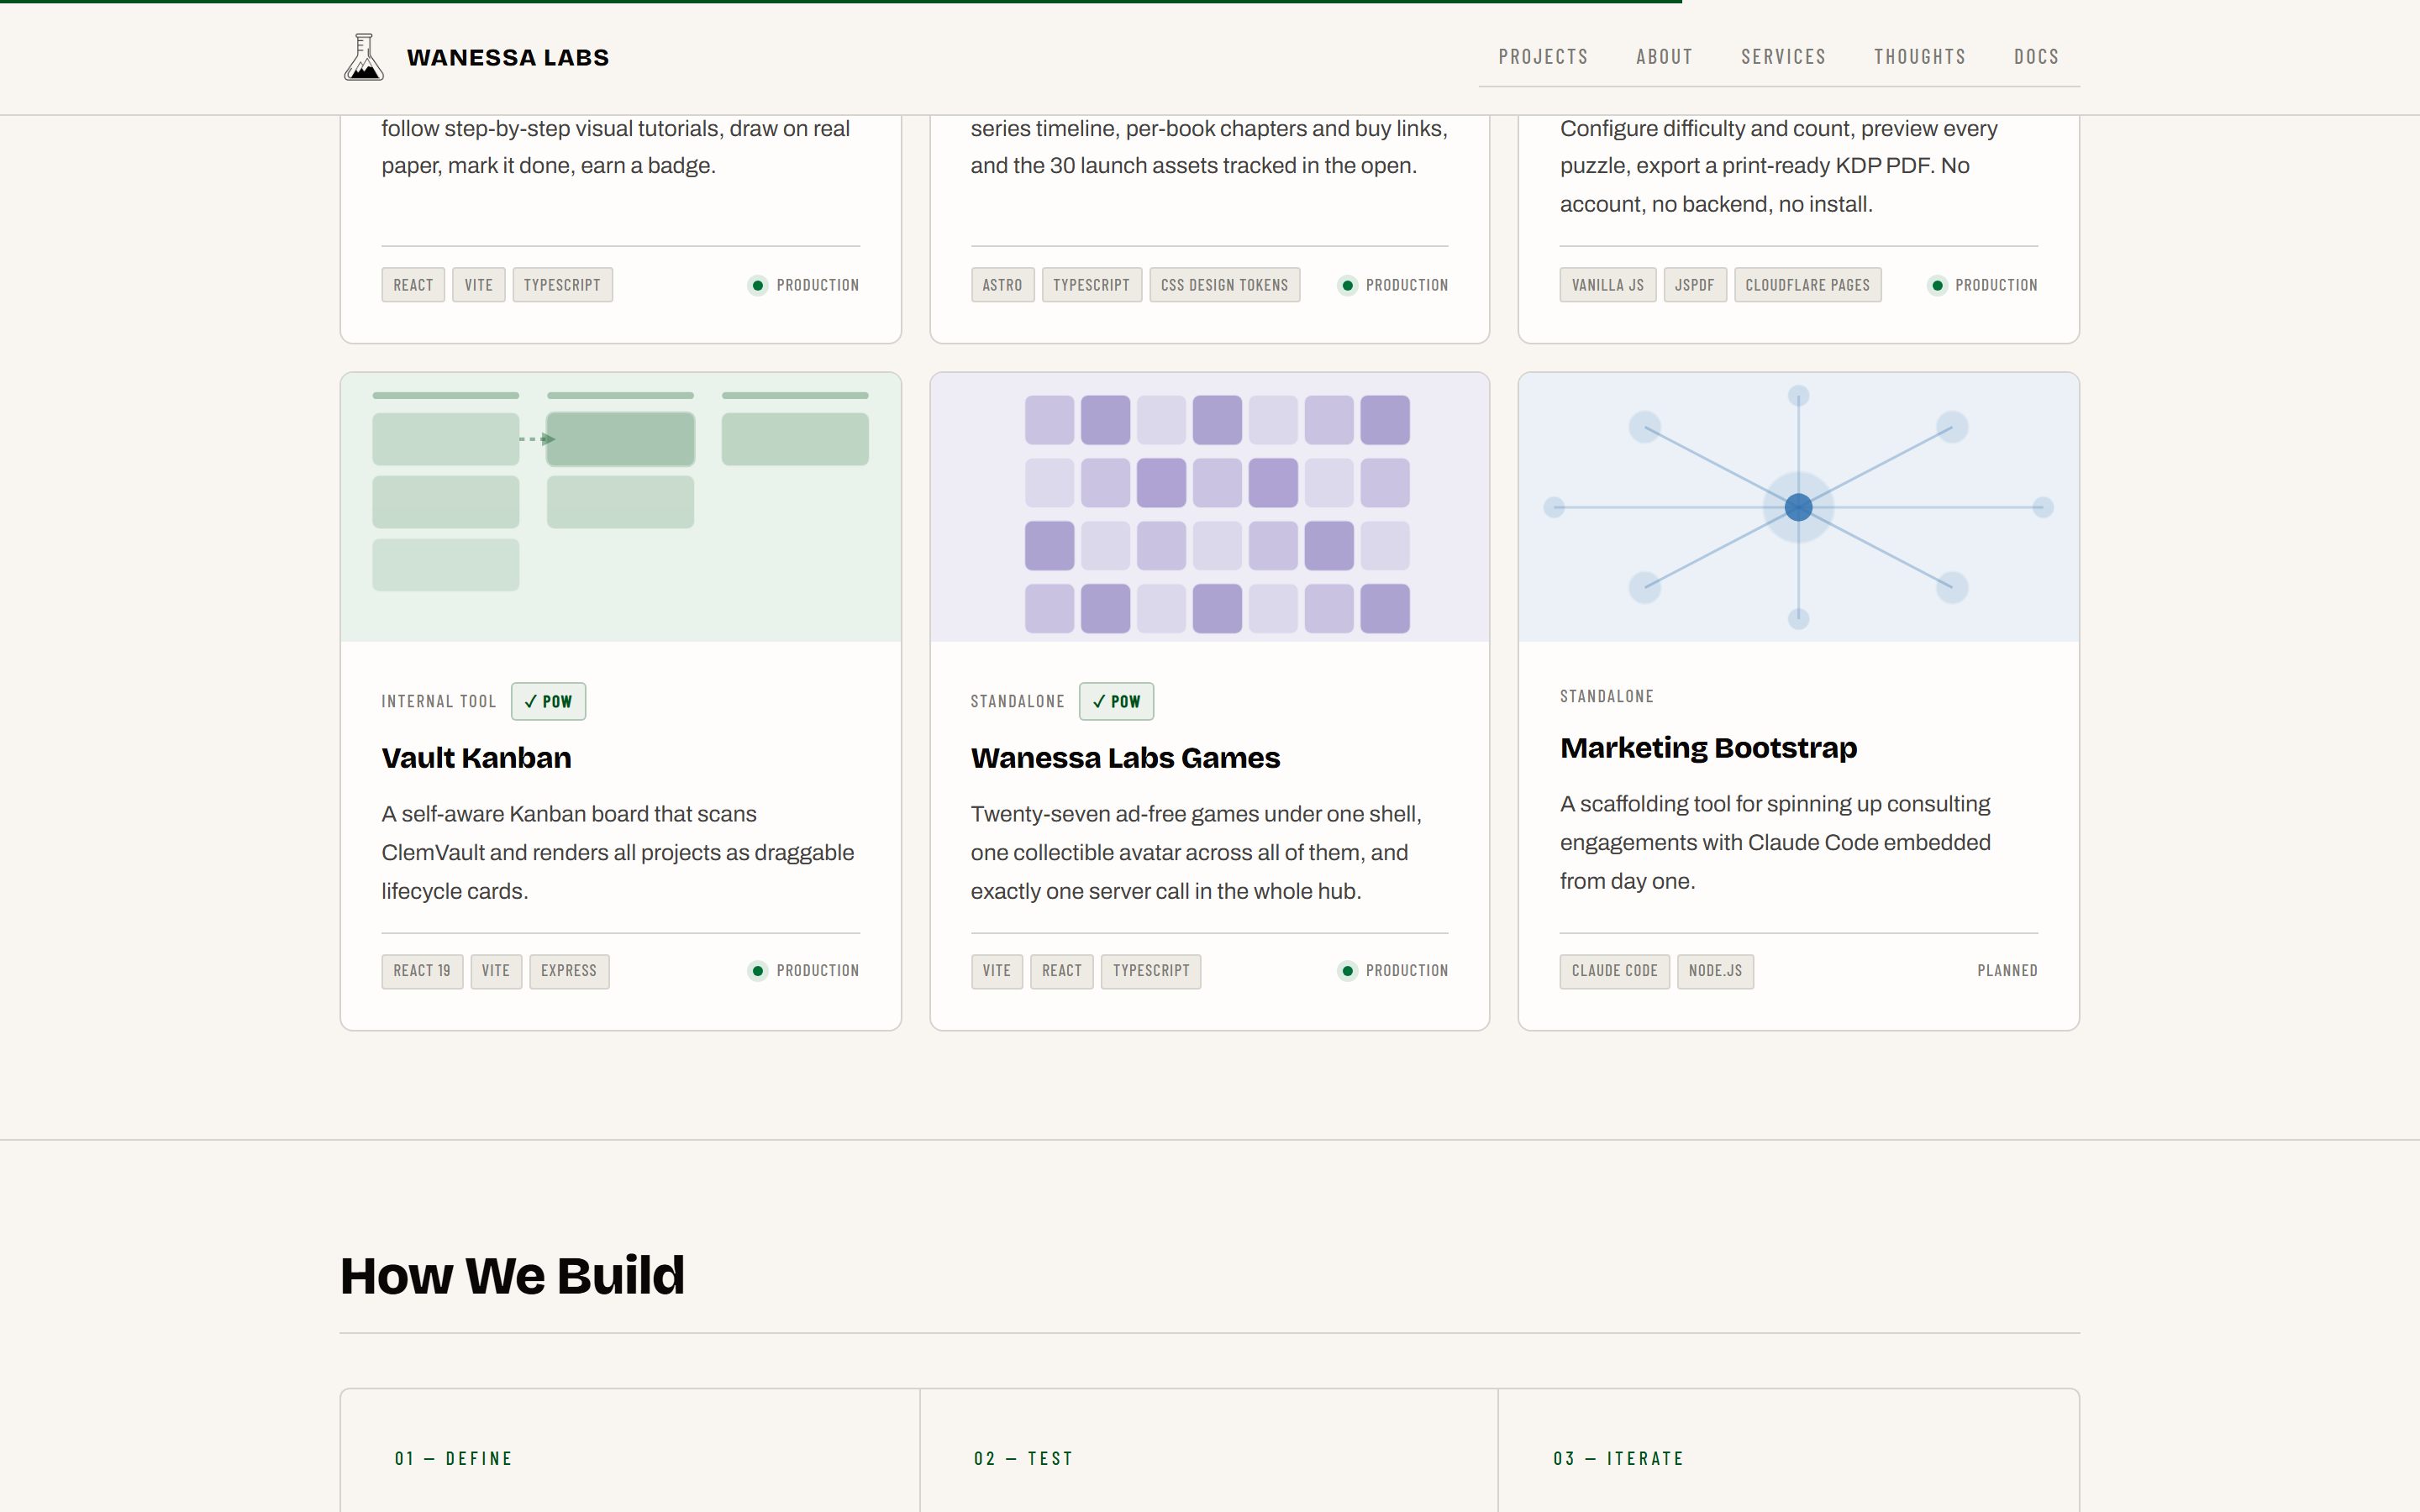
An Astro-powered static site listing all shipped projects, a development timeline showing what shipped and when, and short-form thoughts on AI and automation. Content sourced from markdown files in the vault. No backend, no database, no subscription required to read.
Fast-loading by design. The site proves the point before the reader finishes the first paragraph: this is what building without bloat looks like.
Features
- Project catalog with dedicated pages per ship
- Projects map: a 3D graph of every project, grouped by track
- Development timeline per project, plus a What’s next section on the projects that publish one, and a portfolio-wide feed at /whats-new
- Blog and thoughts collection
- Tip jar via Stripe Payment Link
- No backend, fully static on Cloudflare Pages
- Sub-1-second load time
The Projects Map
The catalog outgrew a list. Five tracks and a project count that keeps climbing is a shape, so /projects opens on a graph you can spin, drag, and click into.
The first version drew it from coordinates I typed by hand. Positions were fixed pixel values and the fan-out angle per cluster was a constant, so the layout had no idea how wide any label actually was. One track grew to 19 projects, and at 19 the names landed on top of each other. Adding a project meant editing numbers.
The rebuild removes the numbers. A small physics simulation runs in the browser: projects repel each other, links behave like springs, and the layout settles into whatever shape the data wants. Nothing is positioned by hand, so the next project places itself.
The text is the part that matters. WebGL draws the bubbles and the hairline links, and nothing else. Every label stays an ordinary link in the page, positioned over the canvas each frame from its node’s position in 3D. That split is what fixes the overlap. A label in the page can be measured, so before it draws it checks the room it needs against every label and bubble already placed, tries 12 positions around its node, and hides rather than overlap. Names cannot collide, because stacking is the one option the layout does not have.
Keeping labels as real links buys the rest for free. You can tab into the graph and open a project from the keyboard, and every project is a real link in the served HTML rather than a shape on a canvas, which is what a search engine needs in order to follow it.
Phones never download any of it. The 3D code loads on desktop only, and only once the map scrolls into view. The accordion that mobile gets is also the desktop fallback when WebGL is missing or the code fails to arrive, so the map area is never an empty box.
Stack
| Tool | Role |
|---|---|
| Astro | Static site generation |
| Tailwind | Utility-first styling |
| three.js | Projects map: bubbles and links only, lazy and desktop-only |
| Cloudflare Pages | Hosting with global CDN |
Revenue Model
Stripe tip link only. No ads, no paywall.